
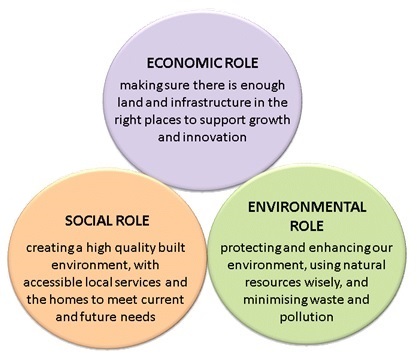
3.1.1 Sustainable development can be described as ‘development which meets the needs of the present without compromising the ability of future generations to meet their own needs’. There is a presumption in favour of sustainable development as a cornerstone of national planning policy, and this is reflected through the policies in this plan. For plan-making, this means that the plan needs to seek the right balance of economic, social and environmental benefits. To do this, we need to:
 understand
local circumstances and resource limits, and what impact failing to
meet needs or exceeding these limits may have on existing and future
generations;
understand
local circumstances and resource limits, and what impact failing to
meet needs or exceeding these limits may have on existing and future
generations;3.1.2 Influencing the pattern of development is a crucial element in seeking to achieve development that is more sustainable. It is about providing opportunities for people to make sustainable choices (although people will inevitably have the freedom to choose how they live their lives).
3.1.3 Localism is about encouraging communities to make decisions for their local area and take an active role in achieving their goals. This plan aims to maximise these concepts while making sure that we do ultimately achieve the growth we need.
| STRATEGIC APPROACH |
In the period 2011-2031 development should help deliver a steady supply of employment and housing land to meet projected needs (about 60ha of employment land and 15,500 new homes across the plan area). The distribution of development is influenced by:
The strategic allocations provide the main development opportunities
and are fundamental to delivering sufficient development. These
are located at Beaminster, Bridport, Chickerell, Crossways, Dorchester,
Lyme Regis, Portland, Sherborne and Weymouth (including an area
north of Littlemoor that lies partly within West Dorset), and
are indicated in Table 3.7. The main towns and smaller settlements
with defined development boundaries also provide a considerable
supply of smaller sites through redevelopment and infill opportunities
that will contribute towards meeting the requirements. |
3.2.1 Councils are expected to identify a supply of specific, developable sites or broad locations for growth for at least a ten year period, and preferably for fifteen. This plan covers the period from 2011 to 2031; this includes a sixteen year period from adoption. The plan will be reviewed in order to provide additional allocations to meet development needs in the latter part of the plan period. Such a review will be informed by updated evidence of the objectively assessed needs, and by monitoring of the delivery of development under the policies of this plan. The plan will need to be reviewed no later than 2021 in order to maintain a robust five-year land supply.
3.2.2 The economy is constantly changing, and its needs may well differ during the plan period. However based on predictions of the likely changes to the local workforce by looking at how the population is ageing and likely in and out-migration, and the type of sectors that may grow, it is possible to make some forecasts about future demand.
3.2.3 Economic forecasts prepared alongside the review of objectively assessed housing needs suggest that around 13,000 additional jobs could be generated in the period up to 2031. There is, however, a large degree of uncertainty over such a long time period and it is possible that the level of new homes being provided may support more jobs or that the economy grows faster than expected. It is also possible that the economy will grow at a slower rate. Nevertheless, planning for this number of additional jobs should help to turn around the recent trend of decling job numbers in the plan area and to support job growth associated with greater in-migration. Accomodating some of these jobs will require land to be allocated and the plan sets a requirement of 60.3ha of employment land across the plan area. This represents 43.6ha in West Dorset and 16.7ha in Weymouth and Portland. The amount of employment land allocated in this plan exceeds the requirements likely to result from the most recent forecasts, but allows for likely vacancies / churn and a degree of market choice.
3.2.4 The population of the plan area is ageing and deaths outnumber births. In-migration from other parts of the United Kingdom helps ‘top up’ our local population and because of this, migration has a positive role to play in supporting our economy and helping keep our communities balanced. Demand from those moving into the area continues to be strong, particularly those in older age groups, and this combined with the ageing resident population means that that there will potentially be a need for some in-migration of economically active people if economic growth is to be achieved.
3.2.5 The latest official population projections for the area are the 2012 Sub National Population Projections. Using these as a start point and making an allowance for more younger people to live and work in the area, we need to provide around 775 new homes each year between 2011 and 2031. By providing for new housing over the plan period we will help to support the economy as it will house the local workforce and also our communities by providing decent, affordable homes and potentially reducing the need for young people to move away from the area.
3.2.6 This level of growth can also help cater for the predicted level of demand for affordable housing. At the beginning of the plan period there were about 3,000 people on the housing register in West Dorset and 4,600 in Weymouth and Portland. New development allocations will help deliver significant amounts of new affordable housing as part of the overall development.
3.2.7 By preparing a joint local plan, which covers the whole strategic housing market area, the two councils can look at the wider area more strategically and enable greater flexibility to deliver the necessary growth. The plan therefore sets out a level of housing provision across the entire plan area, and this will be the basis for the monitoring of development across the area, including the five-year supply of land for housing, in keeping with the national policy requirement to meet such needs across Housing Market Areas. A plan area total for the amount of employment land required has also been set, though indicative minimum targets for each district have also been identified in the policy below.
3.2.8 The following policy sets out how much employment and housing land is proposed during the plan period. Additional allocations of land will be made in the next review of the plan, to meet outstanding needs to 2031 and to address any housing land supply issues identified through regular plan monitoring; these could, for example, include unforeseen delays in delivering particular sites or potential difficulties in achieving a balanced overall development strategy for the plan area.
SUS 1. THE LEVEL OF ECONOMIC AND HOUSING GROWTH
i) In the period 2011-2031 provision will be made for a deliverable
supply of housing land to accommodate in the region of 15,500
dwellings (775 dwellings a year) and around 60ha of employment
land comprising:
⚪at least 43ha in West Dorset;
⚪at least 17ha in Weymouth and Portland.
ii) Further land to meet outstanding needs beyond 2031 wil be
provided in the next review of the plan.
Monitoring Indicator: amount of land developed
for employment by type and proportion on allocated sites. Target:
3ha/annum |
3.3.1 To meet the longer term needs of the plan area a variety of sources of development land for future employment and housing use have been identified. It includes land with existing planning permission and assessments of the amount of development likely to come forward on sites that would be allowed under the general policy framework of the plan. In order to meet the total requirements, however, it has also been necessary to make specific allocations of new land for development.
3.3.2 This section therefore outlines some of the factors that have been taken into account in determining the distribution of development across the plan area. This is followed by summaries of the employment and housing land supply, including an explanation of each each component which contributes to the supply.
3.3.3 Throughout the consultation that informed the plan recurrent themes were meeting local need and enabling local decision making. The development strategy therefore aims to meet local needs, and enable economic growth, whilst safeguarding our special environment. Localism is an important part of the new strategy encouraging communities to take responsibility for their own areas.
3.3.4 The proposed distribution of development takes account of:
3.3.5 The development strategy therefore focuses the majority of new development on the larger settlements, which have more existing jobs and services, broadly in line with the local demand for that area, taking into account current imbalances, the current supply and existing constraints. The overall development strategy is illustrated in the Strategic Diagram – Figure 3.1.
Figure 3.1 – Strategic Diagram
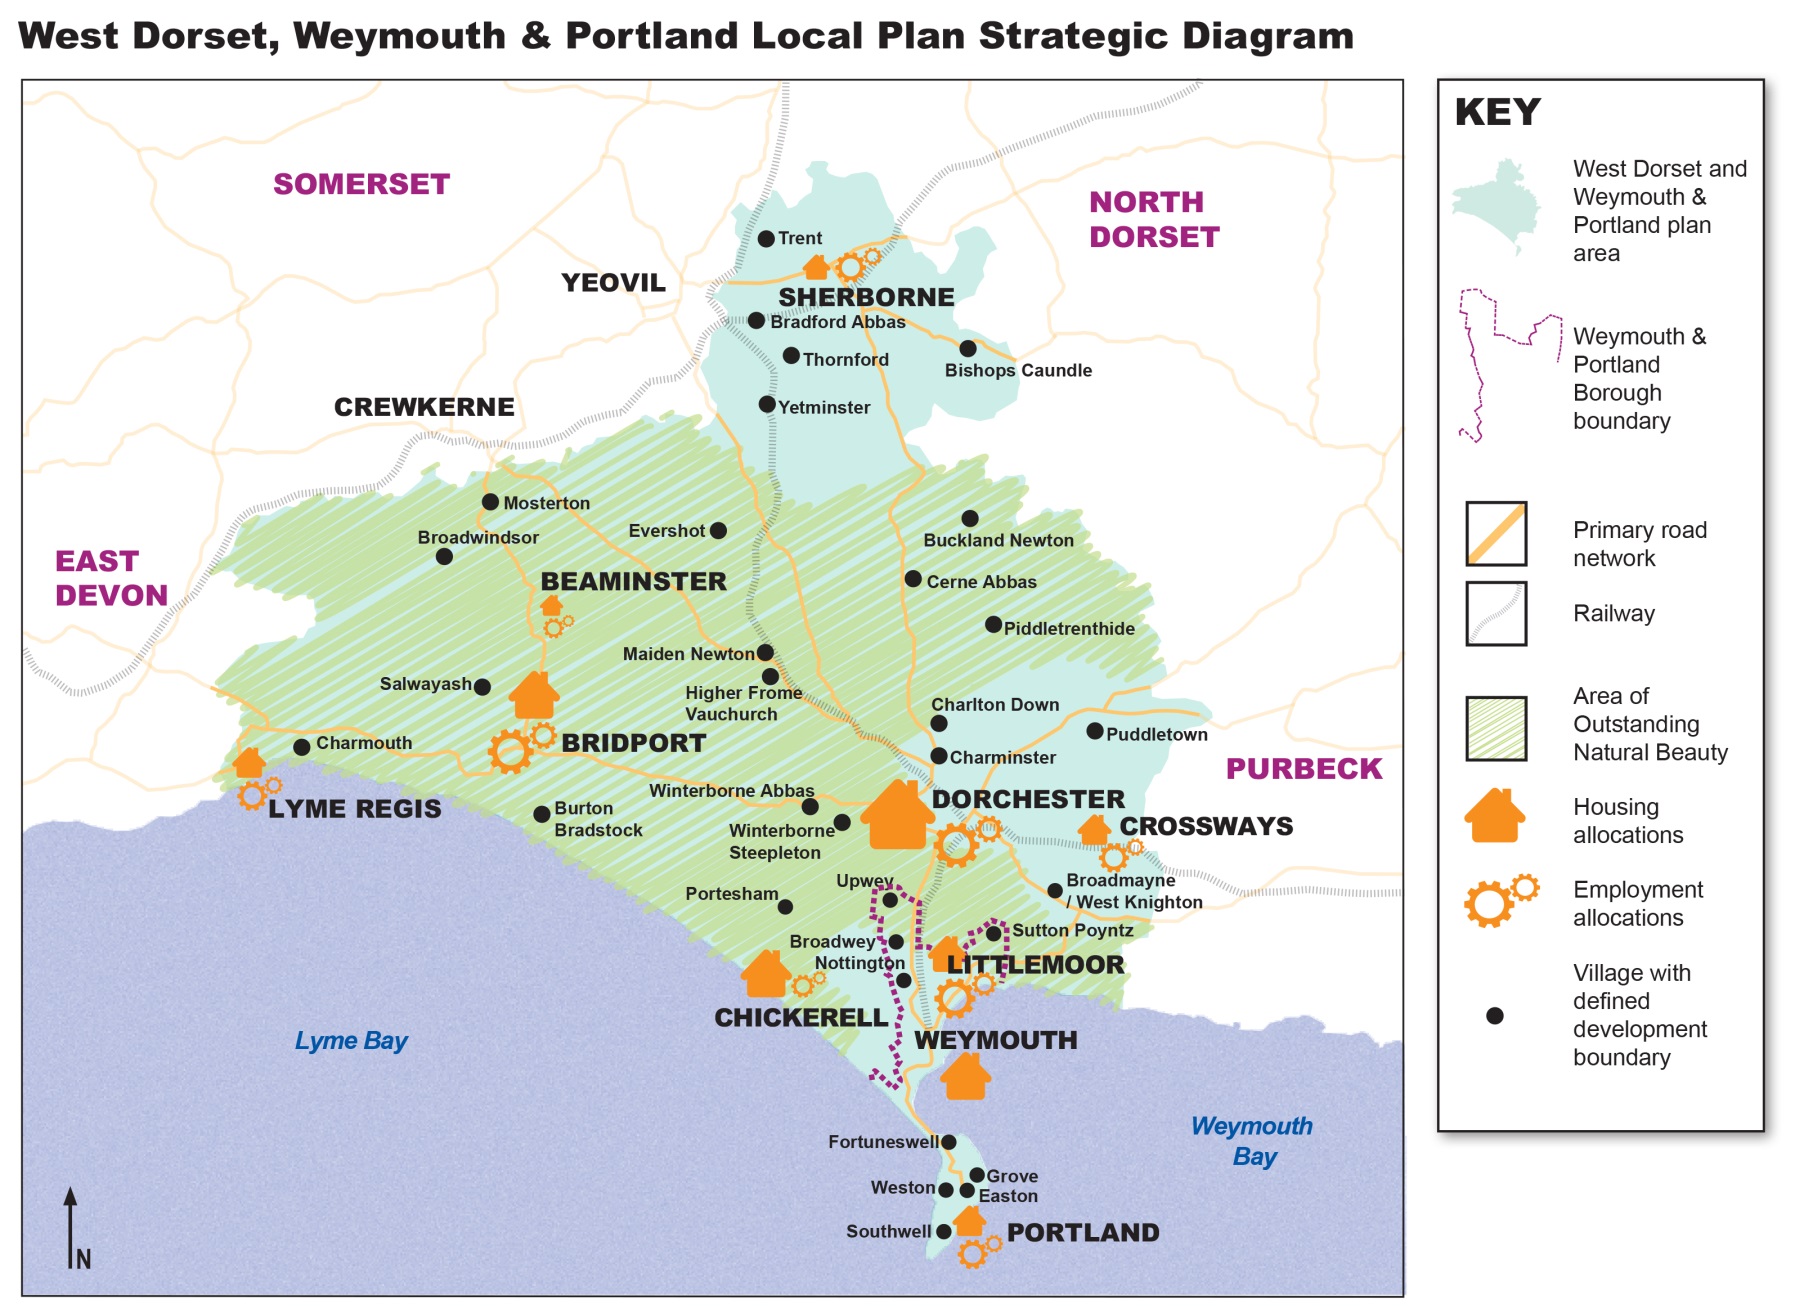
3.3.6 In the plan area, local housing and economic needs cannot be met without major development in the Area of Outstanding Natural Beauty. The need for growth from both a national and local perspective is considered to justify the exceptional circumstances for allowing major development to take place within this nationally designated landscape. Such a stance is not taken lightly. Where growth is proposed, this is because there are no realistic alternatives to meet the need for growth in that area in a positive way, and the sites have been selected on the basis that any landscape impact can be effectively moderated. Indeed there are opportunities, in places, to actively enhance the setting of the AONB through softening the visual impact of the existing urban edge on the wider landscape. Table 3.1 below summarises the main environmental constraints affecting each of the settlements in the plan area.
Table 3.1 – Existing Settlements, their current role and Major Environmental Constraints
Weymouth is an important seaside resort, dominated by lower-paid employment, which currently has a significant amount of outward commuting to Dorchester for jobs. The area is on the coast, and the floodplain of the River Wey runs through the town. The Dorset AONB lies to the north, and the Heritage Coast to the west. |
Dorchester is the county town and an important service area, and relies on a much wider area (including both nearby villages and Weymouth to the south) for its workforce and economic success. The floodplain of the River Frome runs to the north of the town, and the Dorset AONB wraps around the town to the south and west. There are some significant heritage assets in the area, including Maiden Castle hill fort and Poundbury Camp. |
Portland has historically had a good balance of housing and employment, with islanders working predominantly in the numerous quarries, or at the Ministry for Defence and Naval establishments. With the closure of the latter establishments many islanders have had to look for job opportunities on the mainland and some of the employment opportunities created on the island do not match the skills of the local workforce. The coastline around the island is internationally important for its geology, limestone and coastal habitats. |
Bridport is relatively well self contained with a good balance between housing and employment. The town lies within the Dorset AONB. The River Brit and its tributaries (Asker and Skilling) run through the town, creating large green corridors within their floodplains. |
Sherborne has a close relationship economically with the neighbouring town of Yeovil, in Somerset. Sherborne has become an increasingly expensive place to live although many of the jobs within the town itself are relatively low paid, meaning that a significant proportion of the higher-skilled workforce commute out of the town, and there is an inward flow of lesser-skilled workers who cannot afford the local house prices. The River Yeo runs along the south-east side of the town. There are some significant heritage assets in the area, including Sherborne Old Castle. |
Chickerell, which includes the Granby and Lynch Lane industrial estates, provides employment opportunities which serve both Chickerell town and neighbouring Weymouth to the south. The Heritage Coast runs along its western flank. |
Lyme Regis is a small coastal town on the boundary with East Devon. It lies within the Dorset AONB. The River Lim runs from the north through the town Due to its location and constraints, including land instability, there are few opportunities for growth. |
Beaminster is relatively well balanced in terms of employment and housing. It lies within the Dorset AONB. The River Brit and its tributaries run through the town. |
3.3.7 The employment land supply proposed in this plan, compared with the requirement set out in Policy SUS 1, is set out as follows.
Table 3.2 – Employment Land Requirement and Supply 2011-2031
| Employment Land Requirement | West Dorset | Weymouth & Portland | Plan Area |
| Employment Land Supply | 43.6 | 16.7 | 60.3 |
| Completions 2011-12 | 2.0 | 0.6 | 2.6 |
| Planning Permissions | 24.4 | 18.8 | 43.2 |
| Land allocations in this plan | 31.1 | 8.6 | 39.7 |
| Total Supply | 57.5 | 28 | 85.5 |
3.3.8 Table 3.3 below lists the allocations that together make up the employment land supply, some of which are key employment sites. The figures for site areas shown are approximate and further employment opportunities may come forward as part of mixed use schemes. The list does not include existing employment areas where there is scope for additional development which either have permission or would be allowed under Policy ECON 1, which should also bring forward a significant supply of employment premises.
Table 3.3 – Employment Supply
Town |
Site Allocated For Employment |
Employment (ha) |
Key site |
Notes |
Policy Ref |
Weymouth
|
Littlemoor urban extension |
12 |
✔ |
primarily in West Dorset |
LITT1 |
Land at Icen and Weyside Farms |
Potential |
|
in West Dorset |
LITT2 |
|
Portland |
Osprey Quay |
8.6 (minimum) |
|
part with permission |
PORT2 |
Chickerell |
Putton Lane |
Potential |
|
with outline permission |
CHIC1 |
Dorchester
|
Poundbury Urban Extension |
6 (approximate) |
|
with outline permission |
DOR1 |
Poundbury Parkway Farm |
0.9 |
✔ |
site extension |
DOR2 |
|
Weymouth Avenue Brewery |
1.7 (approximate) |
|
with outline permission |
DOR6 |
|
Crossways |
Land at Crossways |
3.5 |
✔ |
|
CRS1 |
Bridport
|
Vearse Farm |
4 |
✔ |
|
BRID1 |
St. Michael’s Trading Estate |
Potential |
|
mixed use scheme |
BRID5 |
|
Beaminster |
Broadwindsor Road |
0.5 |
|
mixed use scheme |
BEAM1 |
|
Lane End Farm |
0.7 |
✔ |
|
BEAM3 |
Lyme Regis |
Woodberry Down |
Potential |
|
|
LYME1 |
Sherborne
|
Barton Farm |
3.5 |
✔ |
mixed use scheme |
SHER1 |
Sherborne Hotel |
Potential |
|
|
SHER3 |
|
Former Gasworks Site |
Potential |
|
mixed use scheme |
SHER4 |
|
Total |
|
39.7 |
|
|
|
3.3.9 The following table sets out the housing land supply to 2031, against the requirement for the whole plan area during this period, set out in Policy SUS 1. The five-year supply is covered in the following section.
Table 3.4 – Housing Requirement and Land Supply 2011-2031
Housing Land Requirement |
15,500 |
Housing Land Supply |
|
Completions 1 April 2011-31 March 2014 |
1,488 |
Extant planning permissions at 1 April 2014 |
3,973 |
Supply from new land allocations in the plan |
3,742 |
Submitted / large identified sites within settlements |
3,834 |
Minor identified sites within settlements likely to be built |
1,783 |
Rural exception sites likely to come forward |
35 |
Total Supply |
14,855 |
3.3.10 The councils have prepared an up-date to the July 2014 SHLAA which was published in February 2015. This includes revised assumptions about each element of supply. These are set out below, with information about the strategic land allocations in the next section.
3.3.11 Data on housing completions has been taken from the annual residential land availability monitioring carried out every year in conjuction with Dorset County Council, with a base date of 1 April each year. The following completion figures relate to both authority areas; for 2011-12 (546), 2012-13 (570) and 2013-14 (372). In total, 1488 homes were built in the plan area between 2011 and 2014.
3.3.12 Extant planning permissions include those on strategic development allocations that have planning permission, such as those at Poundbury, Dorchester, and Barton Farm, Sherborne. These are indicated in grey in Table 3.7 in the following section on strategic land allocations. Assumptions about the likely start dates and rates of development have been made, based on past performance of developments in the plan area and indications of likely development rates provided by the developers. Other planning permissions, on smaller sites, are assumed to come forward within the plan period. These include planning permissions for C2 residential institutions.
3.3.13 Other sites submitted through the Strategic Housing Land Availability Assessment (SHLAA) or identified by officers have been included in the supply where they are located within development boundaries and therefore accord with the policies in the plan. These do not therefore include all the sites that were identified as having development potential in the Strategic Housing Land Availability Assessment. Greenfield sites that were assessed in the SHLAA as potentially developable have either been identified as new allocations in this plan, or will be considered as potential development allocations when the plan is reviewed.
3.3.14 An allowance has also been made for development on minor sites. This has been based on detailed surveys of the built up areas of the settlements in the plan area, to identify potential development sites of up to 0.15 hectares. These minor sites have not been listed individually in the SHLAA but the allowance is based on actual sites and all have been checked to ensure that they do not overlap with sites with permission.
3.3.15 The allowance for rural exception sites is based on those sites where funding has been approved. Other sites in this category are expected to come forward but have not been included. Similarly, it is likely that the change of use of rural buildings to housing and Neighbourhood plans will add to the housing supply but no reliance is placed on the numbers anticipated in these categories until there is convincing evidence of the contribution they will make.
3.3.16 A number of pipeline schemes covering pending planning applications and pre application proposals have been submitted since April 2014. These have not been identified elsewhere in the land supply assessment and while they may come forward they have also been excluded from the supply figures.
3.3.17 Local plans need to demonstrate that a five-year housing land supply is available at the time of adoption, and maintained through the plan period. The target for the five-year supply is five years’ worth of the annual target (in this case, 775 x 5 or 3,875) plus any shortfall from the earlier years of the plan period from 2011. Government also asks authorities to include a buffer of 5%, or 20% where there has been persistent under-delivery previously. Past under delivery prior to the adoption of the Local Plan has resulted in a buffer of 20% being applied across the plan area.
3.3.18 At 1 April 2014, the five-year land supply requirement for the plan area is:
Table 3.5 – Five-year housing land requirement 2014-19
Five-year housing land requirement 2014-19 |
|
Annual requirement (775) x 5 |
3,875 |
20% buffer |
775 |
Shortfall 2011-2014 (837) and 20% buffer |
1,004 |
Total |
5,654 |
3.3.19 The supply to meet this requirement is made up as follows:
Table 3.6 – Five-year Housing Land Supply 2014-2019
| Housing Requirement 2014-19 | 5,654 |
| Supply to meet Requirement | |
| Extant planning permissions at 1 April 2014 (5% lapse rate applied) | 2,687 |
| Submitted / large identified sites within settlements, where reasonable developer indication of delivery before 2019 (20% lapse rate applied) | 1,254 |
| Minor identified sites within settlements likely to be built (4 years with no discount) | 444 |
| Rural exception sites likely to come forward, with RSL funding | 35 |
| Supply Sub-Total | 4,420 |
| Supply from new allocations in the local plan (10% lapse rate applied) | 1,347 |
| Total Supply | 5,767 |
| Supply in Equivalent Years 5,767 / 1,130 | 5.1 years |
3.3.20 Overall, over the five-year period 2014 - 2019 there is land for a total of 5,767 homes to meet needs of 5,654. The identified five-year supply exceeds the five years’ requirement by 113 units. This is the equivalent of a 5.1 year supply of land and is sufficient to provide both flexibility and choice.
3.3.21 In addition to the supply of housing sites outlined in paras 3.3.9 to 3.3.21, additional strategic allocations are needed to ensure that the full plan requirements can be met and the overall development strategy can be delivered. Strategic allocations have the potential to provide for a more comprehensive and planned approach to development, with housing and employment and related facilities such as new schools, brought forward in balance. Such allocations also allow for better control over the phasing and release of development, ensuring that there is a steady supply of land with the necessary infrastructure for that area. Some of these already benefit from permission and therefore are not included in the ‘supply’ from allocations.
3.3.22 The following table sets out strategic allocations for housing within the plan period. The broad locations for strategic development are shown on the strategic diagram.
3.3.23 Many of the larger sites are promoted for mixed use developments. The housing allocations table (Table 3.7) includes previously allocated strategic sites, such as Poundbury in Dorchester, where development has not yet been completed. The table gives an indication, within five-year periods, of when all these sites are likely to be developed. The total numbers of homes on the sites will depend on the mix of house types and sizes, and also the proportions of housing and employment, and may be higher or lower than those indicated. The approximate phasing is indicative and may need to vary between sites to ensure a reasonably continuous land supply throughout the plan period. Where planning permission has been granted but a site-specific policy has been included (in case their development is reconsidered through a new application), these are included in the existing supply figures and therefore have been marked in grey.
3.3.24 Against a total requirement of 15,500 new homes, the plan provides land for around 14,855 new homes, a shortfall of about 645 homes. This is particularly relevant to the last five years of the plan period. The position will be monitored and additional sites brought forward, if necessary, through an early review of the Local Plan. This will ensure the identification of sites to provide an on-going housing land supply for the remainder of the plan period and the broad identification of sites for a five-year period after 2031.
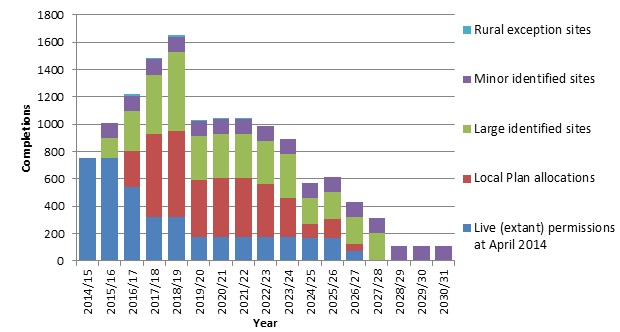
3.3.25 In January 2015 the councils commissioned an independent analysis of the delivery of housing sites over the Local Plan period – this can be found on the councils’ website www.dorsetforyou.com. This provided an independent review of the trajectory set out in the SHLAA Update 2014 and confirms that the councils’ assessment of housing delivery is realistic and deliverable. A housing trajectory, showing the approximate delivery of housing over the plan period, is shown in Figure 3.1. The findings of the independent assessment regarding the strategic housing allocations have been largely incorporated into this trajectory. The delivery of affordable housing as a proportion of the overall housing delivery is not expected to increase until the second five-year period, as the first five years relates primarily to completions on sites where permission has been granted under the previously adopted plans.
Table 3.7 - Housing Allocation Sites with approximate phasing and estimated supply (including large sites with current planning permission in grey shading, which are counted in supply from extant permissions)
| Location | Housing Supply |
Approximate phasing |
Employ-ment land | Strategic Allocation |
Policy Ref |
|||
| 2011-16 | 2016-21 | 2021-26 | 2026-31 | |||||
| WEYMOUTH | ||||||||
| Weymouth Town Centre | 600+ | ⇨ | ⇨ | ⇨ | (possible) | ✔ | WEY1 | |
| Markham and Little Francis | 320 | ⇨ | ⇨ | (possible) | ✔ | WEY10 | ||
| Land south of Louviers Road | 100 | ⇨ | ⇨ | -- | ✔ | WEY11 | ||
| Land at Wey Valley | 320 | ⇨ | ⇨ | (minimal) | ✔ | WEY12 | ||
| The Old Rectory, Lorton Lane | 39 | ⇨ | -- | WEY13 | ||||
| Littlemoor Urban Extension (part) | 150 | ⇨ | ⇨ | ⇨ | ✔ | ✔ | LITT1 | |
| PORTLAND | ||||||||
| Osprey Quay | 35 | ⇨ | ✔ | PORT2 | ||||
| Former Hardy Complex | 384 | ⇨ | ⇨ | ⇨ | -- | ✔ | PORT3 | |
| CHICKERELL | ||||||||
| Putton Lane Area | 220 | ⇨ | ⇨ | ✔ | CHIC1 | |||
| Chickerell Urban Extension | 820 | ⇨ | ⇨ | ⇨ | (minimal) | ✔ | CHIC2 | |
| Land off Rashley Road | 50 | ⇨ | CHIC3 | |||||
| LITTLEMOOR (West Dorset) | ||||||||
| Littlemoor Urban Extension (part) | 350 | ⇨ | ⇨ | ⇨ | ✔ | ✔ | LITT1 | |
| DORCHESTER | ||||||||
| Poundbury Phases 3 and 4 | 1200 | ⇨ | ⇨ | ⇨ | ✔ | ✔ | DOR1 | |
| Weymouth Avenue Brewery Site | 560 | ⇨ | ⇨ | (retain) | ✔ | DOR6 | ||
| Red Cow Farm | 54 | ⇨ | (minimal) | DOR7 | ||||
| Land South of St George’s Road | 50 | ⇨ | (possible) | DOR8 | ||||
| Land off Alington Avenue | 50 | ⇨ | -- | DOR9 | ||||
| CROSSWAYS | ||||||||
| Land at Crossways | 500 | ⇨ | ⇨ | ⇨ | ✔ | ✔ | CRS1 | |
| BRIDPORT | ||||||||
| Vearse Farm | 760 | ⇨ | ⇨ | ⇨ | ✔ | ✔ | BRID1 | |
| Land off Skilling Hill Road | 40 | ⇨ | BRID2 | |||||
| Land east of Bredy Vet’s Centre | 40 | ⇨ | -- | BRID3 | ||||
| St Michael’s Trading Estate | 105 | ⇨ | (retain) | BRID5 | ||||
| BEAMINSTER | ||||||||
| Land north of Broadwindsor Road | 120 | ⇨ | ⇨ | ✔ | ✔ | BEAM1 | ||
| LYME REGIS | ||||||||
| Woodberry Down | 90 | ⇨ | (retain) | ✔ | LYME1 | |||
| SHERBORNE | ||||||||
| Barton Farm | 279 | ⇨ | ⇨ | ✔ | ✔ | SHER1 | ||
| Former gasworks site | 30 | ⇨ | (possible) | SHER4 | ||||
Figure 3.2: Housing Trajectory to 2031
3.3.26 Defined development boundaries have been carried forward from the previously adopted local plans, defining the areas within which development will generally be accepted. The only changes from the previous adopted plans are where defined development boundaries have been extended to accommodate strategic allocations. Information relating to defined development boundaries may be found in the Policies Maps Background Document on the website www.dorsetforyou.com
Settlements with Defined Development Boundaries This list may be expanded through Neighbourhood Plans |
|
Beaminster |
Grove |
3.3.27 Although a lot of demand for new housing exists in the rural areas, allocations or extensions to defined development boundaries have not been made in these locations. Although there are suitable sites, there are problems associated with providing development in locations that have few facilities and where people tend to commute to the towns. It is more difficult to provide cost-effective local services for a more dispersed pattern of development, without putting greater reliance on potential unworkable public transport solutions. The resulting dependency on cars would inevitably increase carbon emissions and disadvantage those who don’t have a car (usually the more vulnerable groups in our society), which is why it makes sense to try to focus development at the towns. And each village will be different in terms of its needs, opportunities and constraints. As such a more enabling approach is proposed for rural communities – working with those that want to see development take place, to help identify suitable sites to meet their local needs. Using neighbourhood development plans and other planning tools, communities can allocate sites, introduce or extend a development boundary, or develop a criteria-based policy to allow development to take place, where they consider this is the right approach for them. This plan does not include targets for development in these areas, and as part of the monitoring process the councils will examine to what extent this approach is delivering growth.
SUS 2. DISTRIBUTION OF DEVELOPMENT
i) Development will be distributed according to the following settlement hierarchy, with a greater proportion of development at the larger and more sustainable settlements.
ii) Within the defined development boundaries residential, employment
and other development to meet the needs of the local area will
normally be permitted.
iii) Outside defined development boundaries, development will
be strictly controlled, having particular regard to the need for
the protection of the countryside and environmental constraints,
and be restricted to:
3.4.1 Existing rural buildings, that are no longer needed for the original purpose for which they were built, provide an opportunity for development without the impact that new buildings would have on the surrounding landscape. The re-use of an existing building may therefore be allowed in situations where new build for the same use would not. It is however important to consider whether the building is worthy of retention (in terms of its structure and how it contributes to local character), the impact on the surroundings that may arise from the changes necessary to enable the re-use, and to also consider what impact the use may have on the local community, local services and the local transport network.
3.4.2 National planning guidance says that in rural areas, housing should be located where it will enhance or maintain the vitality of rural communities, and new isolated homes in the countryside should be avoided. It does recognise that the re-use of redundant or disused buildings should be considered, particularly where development would lead to an enhancement to the immediate setting or represent the optimal viable use of a heritage asset. In our area, affordable housing and essential rural workers’ dwellings are generally supported wherever there is a need. The re-use of buildings for open market housing and built tourist accommodation will be supported in and adjoining established settlements with a population of 200+ (many of which have established development boundaries) as these tend to have some local facilities and are less likely to place an additional burden on services such as school bus / taxi and healthcare out-reach services. Outside these locations an exception may be made where a building adjoins existing serviced residential buildings (such as a farmhouse) and can be tied to the wider holding / main property. The tie ensures that the re-use directly benefits the local family / community (for example, by housing relatives, providing local rented accommodation, or let as tourist accommodation) and that the local benefit is maintained in the longer term. Where a tie to the wider holding / main property is required, this will need to be secured through a section 106 agreement. By taking a flexible approach to housing or tourist accommodation in these circumstances, the upkeep of rural buildings that make a positive contribution to the local character, and the availability of accommodation to meet evolving local needs (whether for the local family or rural business) can be assured. Open market housing and tourism uses will only be allowed where the building was in existence in 2011 (the start of the plan period). The reason for this is to avoid potential abuse of this policy through the building of new agricultural buildings with the intention of converting them in to open market homes in locations where they would not normally be permitted.
Settlements of 200+ Population without a Defined Development Boundary (to be read in conjunction with the list of settlements with development boundaries (para 3.3.28) |
|
|
|
SUS 3. ADAPTATION AND RE-USE OF BUILDINGS OUTSIDE DEFINED DEVELOPMENT BOUNDARIES
i) The adaptation and re-use of rural buildings will be permitted where:
ii) and where development is for one of the following uses:
3.4.3 The replacement of rural buildings will normally be permitted where their continued use (either for the existing use or an agreed alternative use), alteration or extension would be acceptable, although consideration should be given to whether it would be more practicable to re-use the existing building. The replacement of a farm building that makes a positive contribution to the local character (such as the many stone barns and farmhouses) will be resisted.
SUS 4. THE REPLACEMENT OF BUILDINGS OUTSIDE DEFINED DEVELOPMENT BOUNDARIES
i) The replacement of a building should be permitted where the existing building is of permanent and substantial construction, and its continuing use would otherwise be consistent with other policies in this plan. Where this would involve the loss of a heritage asset, or a farm building that makes a positive contribution to the local character, its replacement must be shown to produce substantial planning benefits, such as economic regeneration or environmental enhancement.
| Monitoring Indicator: the number and location of completions for the re-use and replacement of buildings outside defined development boundaries by use. |
3.5.1 In 2012 the government provided a number of new planning tools for local communities, including neighbourhood development plans, neighbourhood development orders and community right to build orders. These tools provide a genuine opportunity for local people to influence what is built in their area, which in turn should foster greater trust in the planning process, as well as deliver development that is in tune with local people’s wishes. The tools are meant to enable development to happen, for example by allocating sites for development, or allowing the type of development that local people would want.
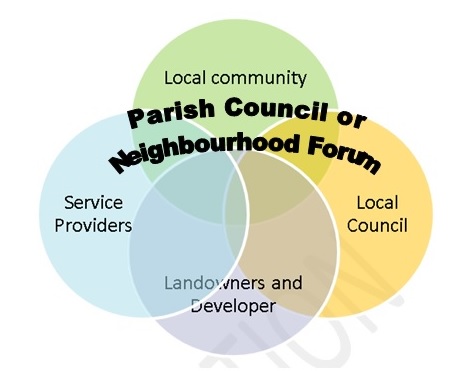 3.5.2
This new planning approach has the potential to bring together communities
(including those that live, work or visit the area), parish / town councils
or neighbourhood forums, landowners and developers and service providers
to build a consensus about the future of their area, and should help
create lasting partnerships both within and outside the community.
3.5.2
This new planning approach has the potential to bring together communities
(including those that live, work or visit the area), parish / town councils
or neighbourhood forums, landowners and developers and service providers
to build a consensus about the future of their area, and should help
create lasting partnerships both within and outside the community.
3.5.3 A neighbourhood development plan becomes part of
the development plan, and its policies will work alongside, and where
appropriate, replace the policies in the local plan where they overlap.
Neighbourhood development orders and community right to build orders
will give permitted development rights to the types of development specified
in that order, allowing developments that are consistent with the strategic
policies of the development plan to proceed without unnecessary delay.
The policies will only apply to the specific area covered by that neighbourhood
development plan or order (rather than the local plan area).
3.5.4 Neighbourhood development plans have the potential to deliver a step-change in the level of growth in the plan area. They can make significant changes to the policies in this plan, so long as they do not undermine its strategic objectives and approach. Examples of changes could include:
3.5.5 They can also provide greater certainty over what is special about an area and how those features should be considered in allowing new development.
3.5.6 West Dorset District Council and Weymouth & Portland Borough Council will support communities that wish to use these new planning tools, by providing advice and assistance. As a minimum this will include advice on the area that the plan or order should cover (as this will need to be approved), and help identifying the extent to which their proposals are in general conformity with national planning policy and the strategic objectives and approach of this local plan. A greater level of support will be directed at those communities that can help in the delivery of sustainable growth in the plan area.
3.5.7 The first Neighbourhood Development Plan in West Dorset at Cerne Valley was ‘made’ on 8 January 2015, following an Inspector’s report in August 2014 and a referendum held in December 2014. The amendment to the development boundary for Cerne Abbas and the addition of a development boundary for Godmanstone have been incorporated into the Local Plan.
SUS 5. NEIGHBOURHOOD DEVELOPMENT PLANS
i) Neighbourhood Development Plans should:
Monitoring Indicator: the number of Neighbourhood
Development Plans, Neighbourhood Development Orders and Community
Right to Build Orders adopted. |
< Previous | ^ Top | Next >